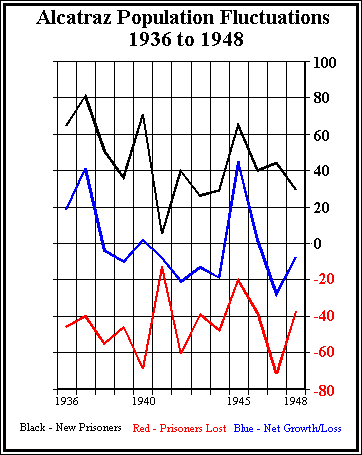
| 1935 | 1936 | 1937 | 1938 | 1939 | 1940 | 1941 | 1942 | 1943 | 1944 | 1945 | 1946 | 1947 | 1948 | |
| New Prisoners | 247 | 65 | 81 | 51 | 36 | 71 | 5 | 40 | 26 | 29 | 65 | 40 | 44 | 30 |
| Prisoners Lost | 5 | 46 | 40 | 55 | 46 | 69 | 13 | 61 | 39 | 48 | 20 | 38 | 72 | 38 |
| Net Growth/Loss | 242 | 19 | 41 | -4 | -10 | 2 | -8 | -21 | -13 | -19 | 45 | 2 | -28 | -8 |
Move on to the next chart: Transfers from Alcatraz
Copyright 1997 by Joel GAzis-SAx