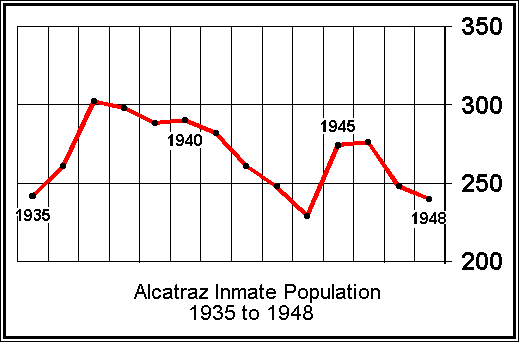
| 1935 | 1936 | 1937 | 1938 | 1939 | 1940 | 1941 | 1942 | 1943 | 1944 | 1945 | 1946 | 1947 | 1948 |
| 242 | 261 | 302 | 298 | 288 | 290 | 282 | 261 | 248 | 229 | 274 | 276 | 248 | 240 |

| 1935 | 1936 | 1937 | 1938 | 1939 | 1940 | 1941 | 1942 | 1943 | 1944 | 1945 | 1946 | 1947 | 1948 |
| 242 | 261 | 302 | 298 | 288 | 290 | 282 | 261 | 248 | 229 | 274 | 276 | 248 | 240 |
Move on to the next chart: Net Growth of Prisoner Population
Copyright 1997 by Joel GAzis-SAx